")
")
Prior to and after RBC application all patients were examined by electropuncture diagnostics method according to R. Voll.
Mini-Expert DT device was used for examination, the data were processed with Imedis software. The method description and the certificate are available at http://imedis.ru. The diagnostic was performed by near patient testing, enabling to obtain data of the functional state of the most important human systems within 15 – 20 minutes. We reviewed circle diagrams, integral coefficient of the total deviation of all electrical potentials in reference measurement points and the list of automatic diagnoses.
Interpretation of reports on electropuncture diagnostics according to R. Voll
Circle diagrams
Colored (grey, green) circular line defines a reference range of electrical potentials (EP) in reference measurement points (RMP) from 50 to 65 units.
Grey line – EP values in RMP prior to correction, the red one – after correction.
Double line shows potential loss 10 seconds prior to measurement. Normally, there shall be no losses.
Potential drop (indicated by double line) evidences functional or organic disorders, caused by parabiosis or cell destruction processes in corresponding organs and tissues. In case of pathological conditions the potential drop exceeds 5 relative units and correlates to severity of the process.
Meridians condition
Normal range of electrical potentials (EP) in reference measurement points (RMP) of meridians is from (50 - 0) to (65 - 0) units.
The first digit shows the value of the starting potential, the second one – EP loss during the time of measurement.
Interpretation of EP measurement findings
|
EP values (rel. units) |
Interpretation |
|
100 |
Acute (suppurative) inflammation |
|
From 90 to 99 |
Acute or catarrhal inflammation |
|
From 82 to 89 |
Subacute, local inflammation |
|
From 66 to 81 |
Prepathological strain of the function |
|
From 52 to 65 |
Range of physiological strain |
|
50 ?+? 1 |
Ideal norm |
|
From 42 to 48 |
Early dystrophic process |
|
From 32 to 41 |
Progressive dystrophic process |
|
From 22 to 31 |
Destructive process with partial atrophy of cell structures of an organ or a system |
|
From 0 to 21 |
Total atrophy or malignification of cell structures of an organ or a system |
Names of meridians
|
ЛИ |
LYMPHATIC VESSEL |
|
ЛЕ |
LUNGS |
|
Тл |
COLON |
|
Нд |
DEGENERATION OF NERVE FIBERS |
|
Кр |
BLOOD CIRCULATION |
|
Ал |
ALLERGY |
|
Од |
DEGENERATION OF ORGANS |
|
Энд |
ENDOCRINE SYSTEM |
|
Се |
HEART |
|
Тн |
SMALL INTESTINE |
|
Сп |
SPLEEN/PANCREAS |
|
Пе |
LIVER |
|
Су |
DEGENERATION OF JOINTS |
|
Же |
STOMACH |
|
Стд |
DEGENERATION OF CONNECTIVE TISSUE |
|
Ко |
SKIN |
|
Мж |
Adipose degeneration |
|
Жп |
GALL BLADDER |
|
По |
KIDNEYS |
|
Мп |
URINARY BLADDER |
Diagrams of integral coefficients (IC)
Show percentage of measured electrical potentials deviation from norm in reference measurement points (RMP). Normal IC = 0. The higher the IC is, the worse is the state of the energy source.
Integral coefficients (IC) dynamics - total deviation of all measured electrical potentials on the right and on the left from norm. Normal IC = 0.
1 – Prior to correction
2 – After correction
Dates and time of diagnostics are listed in the right upper side.
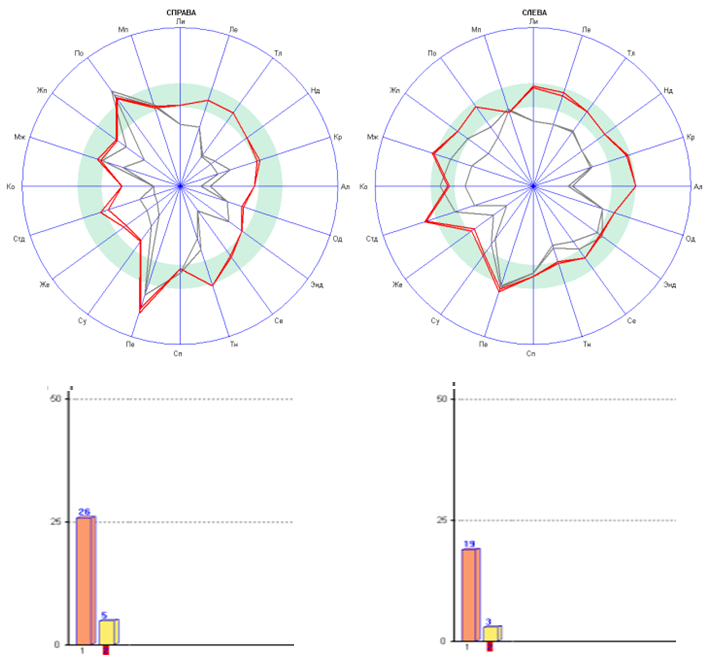
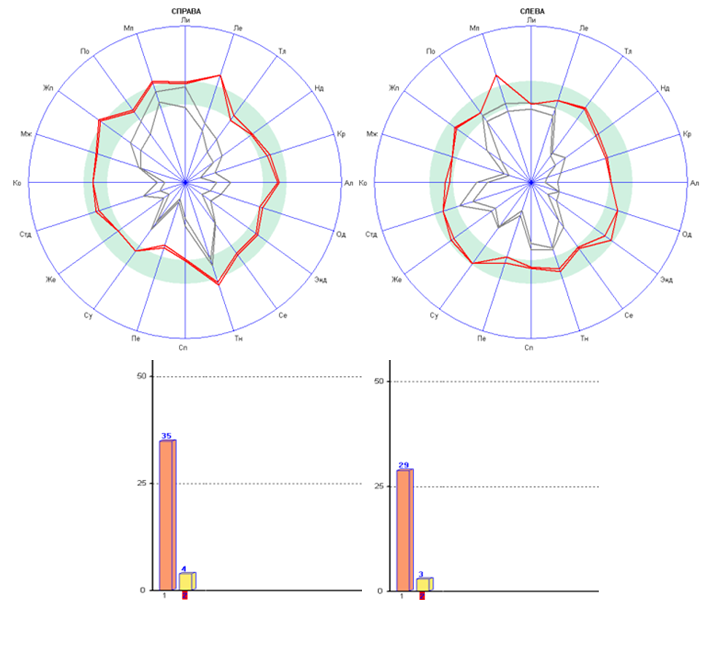
Patient А. 30 years old
Prior to RBC circle diagrams were asymmetric due to a more prominent depression of meridians, relating to the upper part of the body, reduced energy source, many meridians show loss of EP during 10 seconds of measurement.
After RBC energy source is restored, circle diagrams are more symmetric, it is seen that liver and the right kidney meridians are activated (load on filtering organs).
Prior to RBC IC of deviation from norm is moderately increased, there is a prominent asymmetry of values, showing predominance of the right hemisphere.
After RBC IC decreased to 5 on the left and to 3 on the right, values became less asymmetric.
Patient А. 9 years old
Prior to RBC – prominent asymmetry of circle diagrams, most of meridians sow EP loss within 10 seconds of measurement, meridians depression is more prominent at the left.
After RBC, increase of energy source, diagrams became less asymmetric, EP of most meridians within the reference range.
Prior to RBC – high IC of deviation from norm: 31 on the right, 41 on the left, prominent asymmetry of values, evidencing predominance of the left hemisphere.
After RBC – IC on the right decreased to 6, on the left – to 5, insignificant asymmetry.
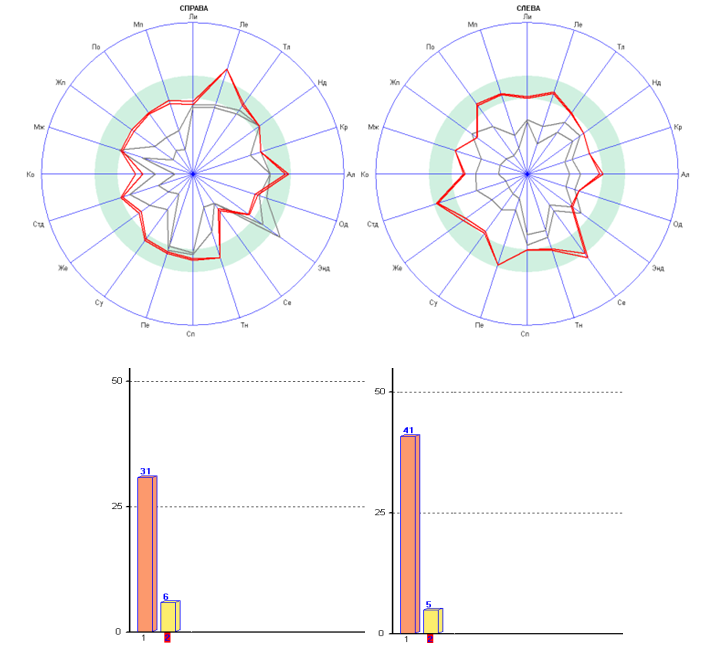
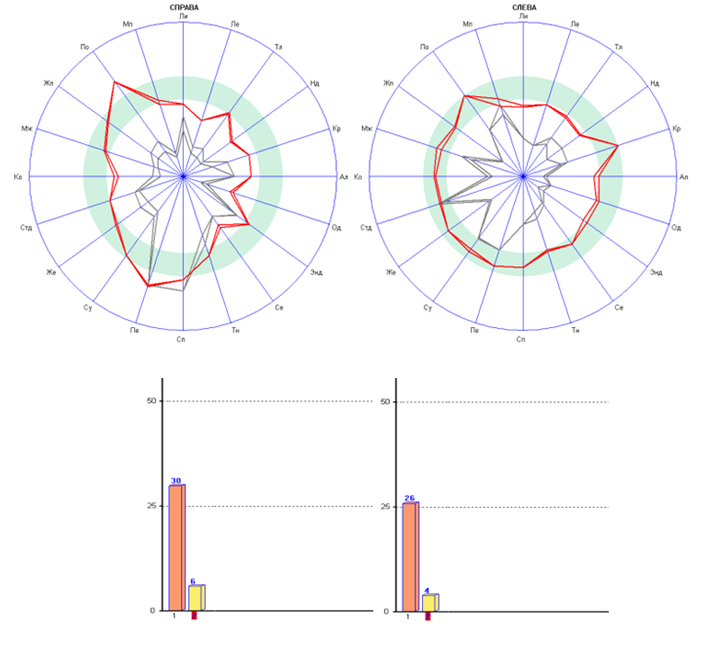
Patient B. 41 year old
Prior to RBC asymmetric circle diagrams, reduced energy source, most meridians show EP loss, on the right the liver meridian is activated (load on the filtering organ), on the left the spleen meridian is activated (load on the immune system). After RBC the energy source is restored, diagrams became less asymmetric, load on the liver is decreased, load on the immune system remains.
Prior to RBC – moderately increased IC of deviation from norm, but prominent asymmetry of values with predominance of the right hemisphere.
After RBC IC decreased to 5, no asymmetry.
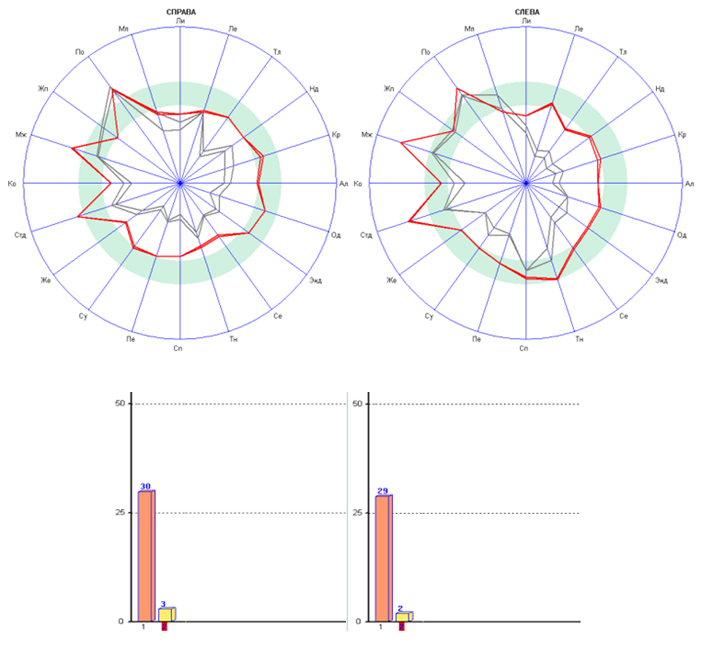
Patient B. 61 year old
Prior to RBC energy source is reduced, asymmetric circle diagrams due to a more prominent depression of meridians, relating to the upper part of the body. On such background the liver meridian is activated (load on the filtering organ) and the spleen meridian is activated (load on the immune system).
After RBC energy source is restored, there is virtually no asymmetry. Load on the liver remains.
Prior to RBC IC is moderately increased – on the right 27, on the left 29.
After RBC IC on the right decreased to 2, on the left – to 4.
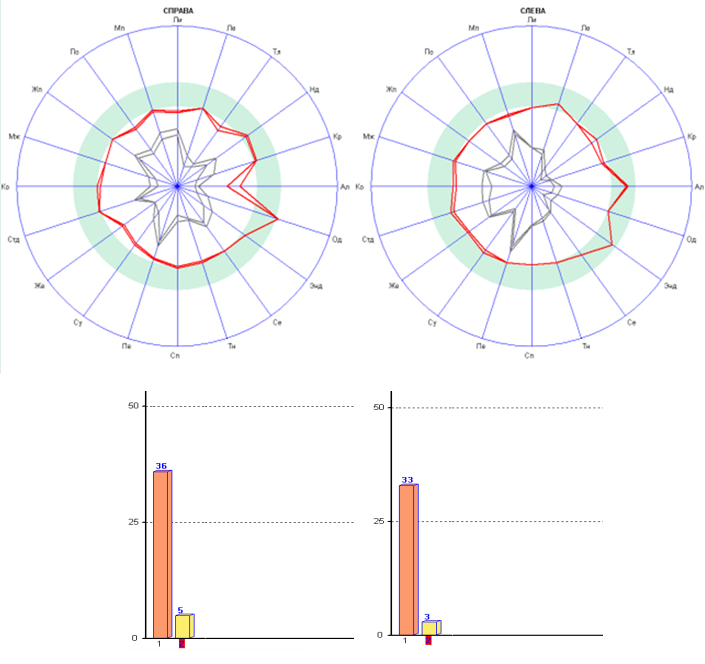
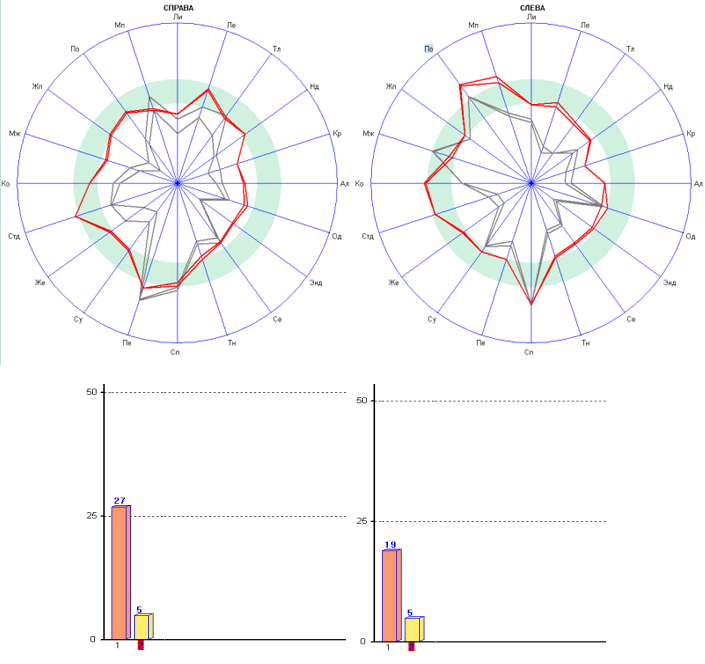
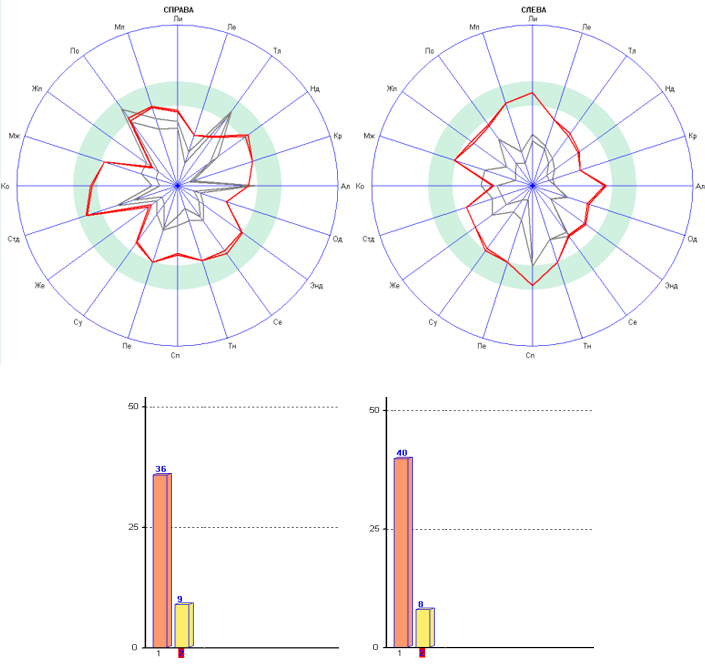
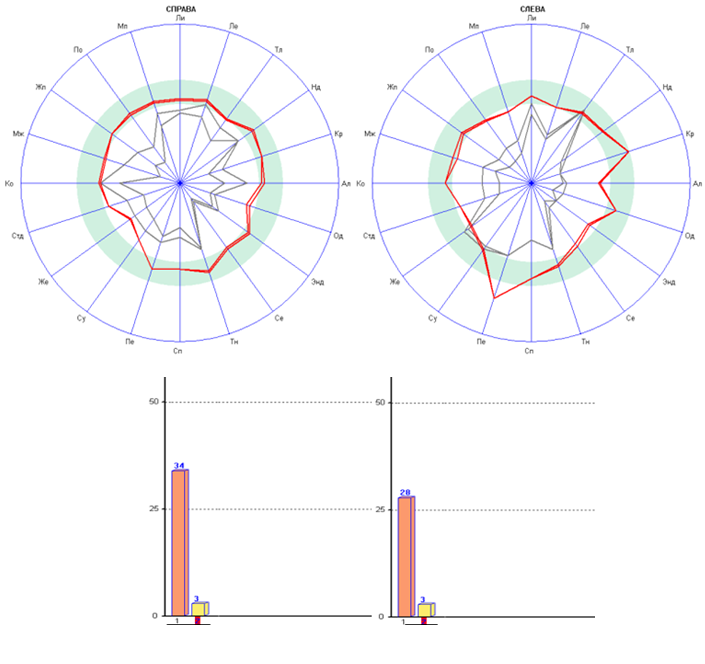
Patient B. 27 year old
Prior to RBC sharp decrease of energy source at a young patient.
After RBC an excellent result – energy source is restored, symmetric circle diagrams.
Prior to RBC – high IC of deviation from norm – on the right 36, on the left 33.
Good result after RBC – IC on the right 5, on the left 2.
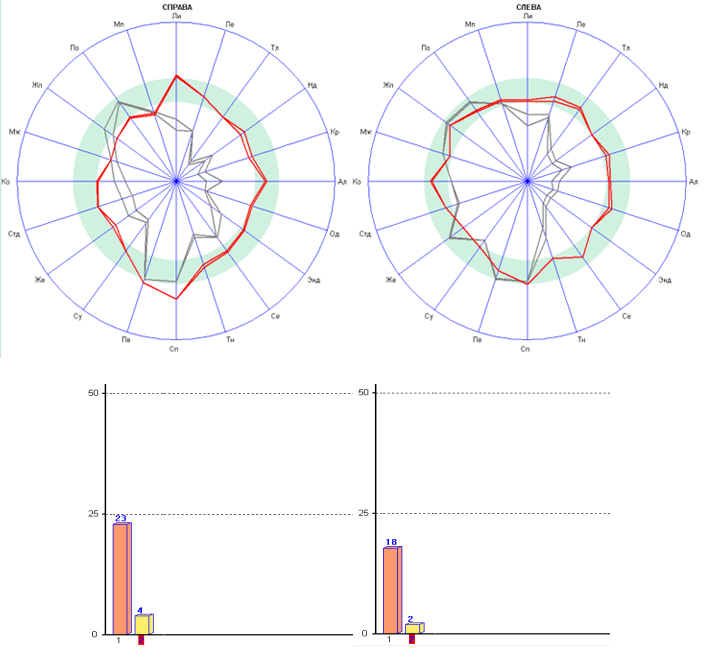
Patient B. 42 years old
Prior to RBC reduced energy source, asymmetry of circle diagrams due to a more prominent depression of meridians, relating to the upper part of the body.
After RBC energy source is restored, the circle diagram on the left is symmetrical, on the right there is a small asymmetry due to activation of the spleen, gall bladder and urinary bladder and small decrease of EP of meridians, relating to adipose degeneration, gall bladder and urinary bladder. Prior to RBC IC of deviation from norm is moderately increased – on the right 23, on the left 18, but asymmetry of values is prominent with predominance of the right hemisphere.
After RBC IC is decreased to min, asymmetry is decreased.
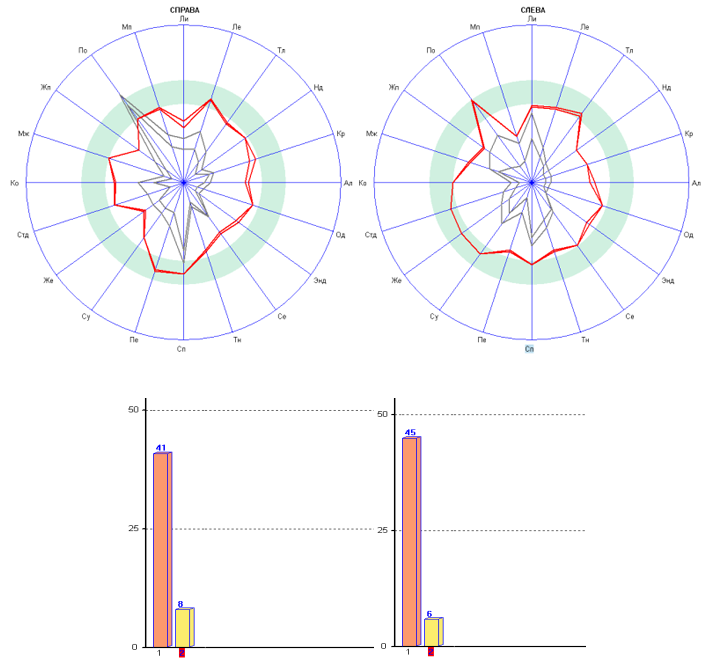
Patient B. 49 years old
Prior to RBC extremely low energy source, loss of EP with most meridians within 10 seconds of measurement, on the right the kidneys meridian is relatively activated however EP is lost.
After RBC diagrams are considerably less asymmetric, energy source is increased.
Prior to RBS a very high IC of deviation from norm – on the right 41, on the left 45, which evidences prominent degeneration processes in the organism.
After RBC – good positive dynamics – IC on the right decreased to 8, on the left – to 6.
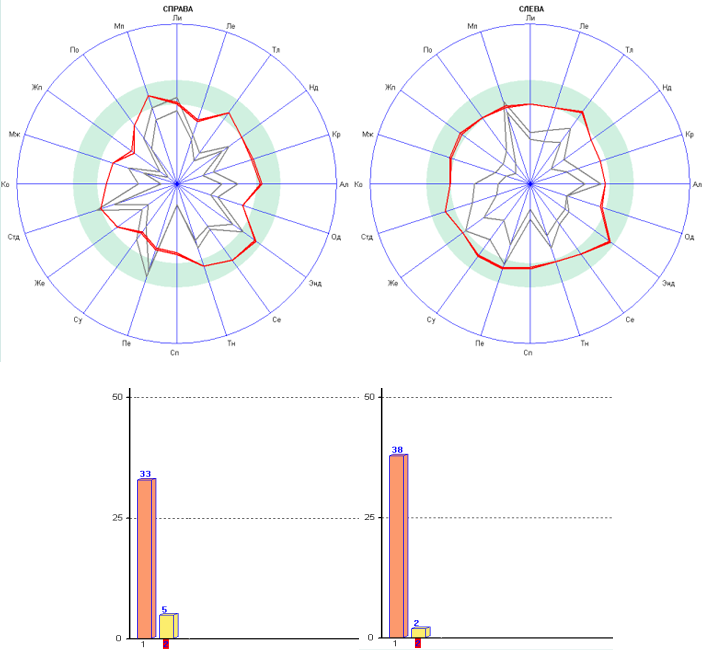
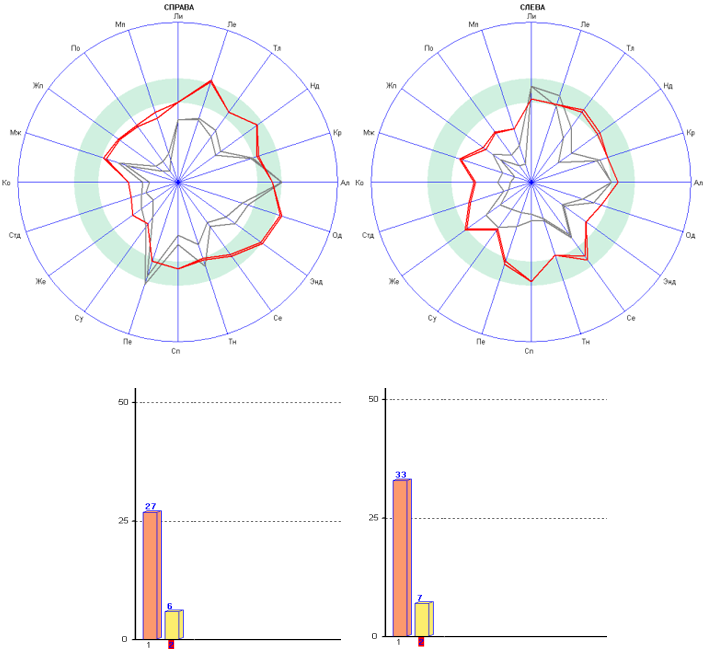
Patient V. 44 years old
Prior to RBC – depression of most meridians, EP loss within 10 seconds of measurement (low energy source), asymmetry of circle diagrams.
After RBC energy source is restored, the diagram on the left is symmetric, there is an insignificant asymmetry on the right.
Prior to RBC IC of deviation from norm on the right was 33, on the left 38, asymmetry of values with predominance of the left hemisphere.
After RBC IC on the right decreased to 5, on the left to 2, asymmetry is less prominent.
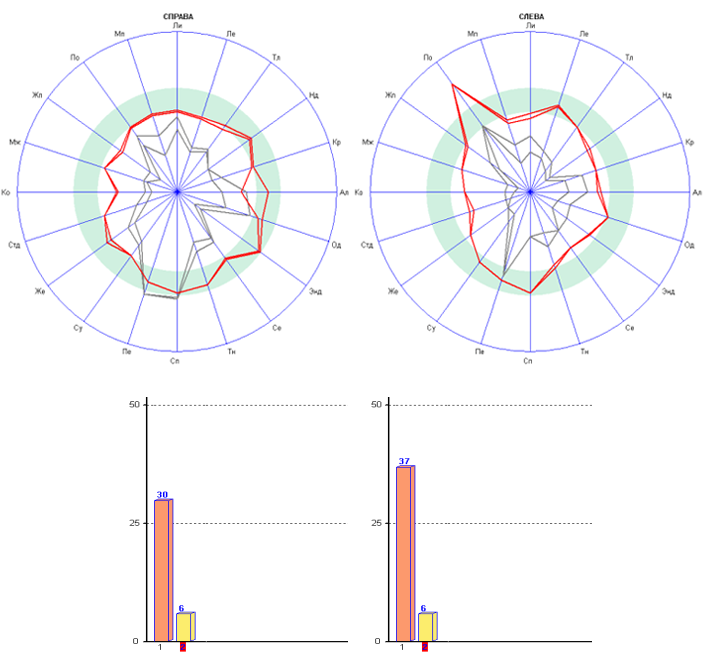
Patient Е. 46 years old
Prior to RBC depression of most meridians, EP loss within 10 seconds of measurement (low energy source), asymmetric circle diagrams.
After RBC energy source is restored, circle diagrams are more symmetric, on the left the kidneys meridian is activated (load on the filtering organ).
Prior to RBC considerably high IC of deviation from norm and prominent asymmetry of values – on the right 30, on the left 37.
After RBC values are symmetric – 6 on the right and on the left.
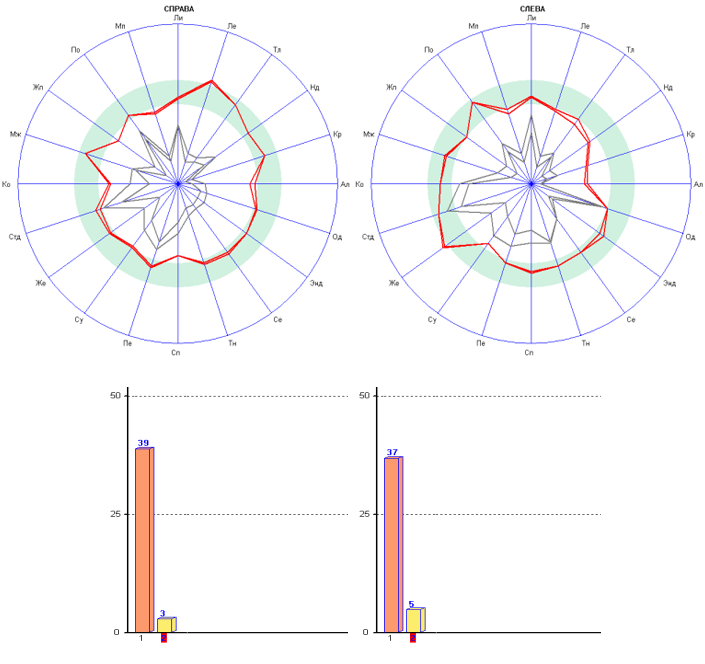
Patient К. 49 years old
Prior to RBC very low energy source, asymmetric circle diagrams.
After RBC energy source is restored, circle diagrams are more symmetric.
Prior to RBC high IC of deviation from norm – on the right 39, on the left 37.
After RBC good positive dynamics – decrease of IC to min – on the right 3, on the left 5.
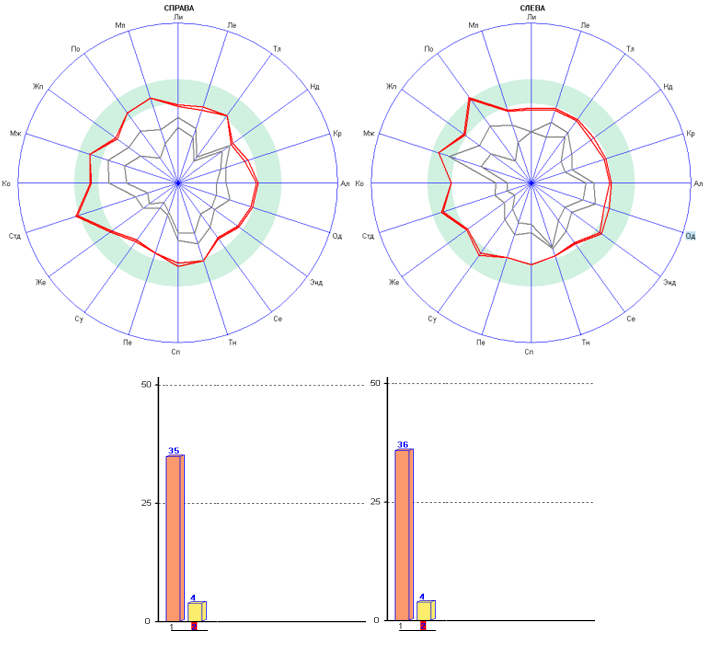
Patient К. 54 years old
Prior to RBC very low energy source (depression of all meridians and loss of EP within 10 seconds of measurement).
After RBC – excellent dynamics – energy source is restored.
Prior to RBC high IC of deviation from norm – on the right 35, on the left 36.
After RBC decrease of IC to min level – 4 on both sides.
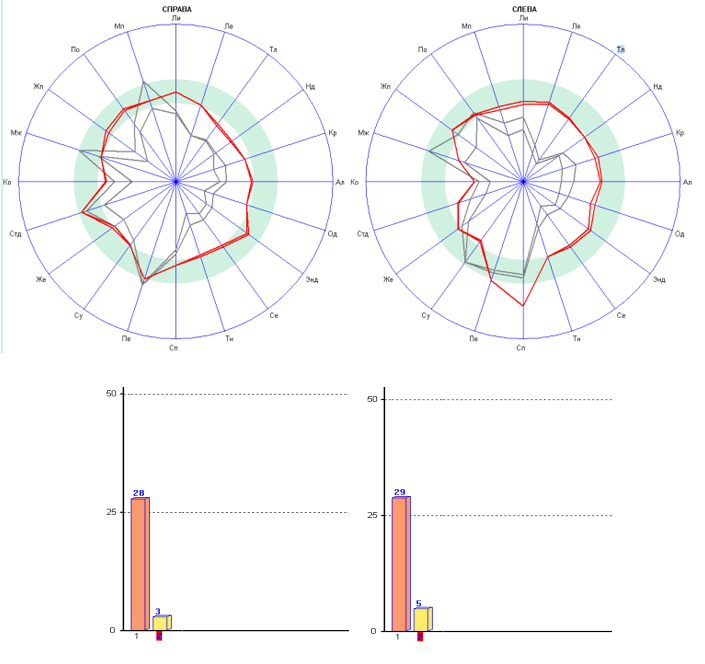
Patient К. 40 years old
Prior to RBC asymmetric circle diagrams due to more prominent depression of meridians, relating to the upper part of the body, energy source is reduced, loss of EP within 10 seconds of measurement.
After RBC energy source is restored on the left the spleen meridian is activated (load on the immune system), the skin meridian depression which was present prior to RBC, persists.
Prior to RBC IC of deviation from norm on the right 28, on the left 29.
After RBC values decreased to min – on the right 3, on the left 5.
Patient К. 40 years old
Prior to RBC distinct asymmetry of circle diagrams, most part of meridians are depressed, EP is lost within 10 seconds of measurement, low energy source. At this background the right kidney and the colon meridians are relatively active, which can be interpreted as the organism’s efforts to compensate an abrupt depression of the most important filtering organs’ (liver and gall bladder) function.
After RBC energy source increased considerably, however diagrams remained asymmetric due to depression of the lungs, colon, stomach, gall bladder meridians. EP of the liver meridian within the normal range, which evidences improvement of the liver’s functional capacity.
Prior to RBC IC of deviation from norm was considerable – on the right 36, on the left 40, values were asymmetric. After RBC IC on the right decreased to 9, on the left – to 8, asymmetry diminished.
Patient К. 2 years old
Prior to RBC pronounced asymmetry of circle diagrams due to a more prominent depression of the lower part of the body meridians, low energy source, loss of EP within 10 seconds of measurement. At this background the liver and allergy meridians on the right and the lymphatic system meridians on the left are relatively active, which can be interpreted as the organism’s efforts to compensate an abrupt depression of the kidneys’ functional capacity (very low EP of the kidneys meridian).
After RBC asymmetry of the diagrams diminished, energy source increased considerably.
Prior to RBC IC of deviation from norm was quite high – on the right 27, on the left 33, asymmetry of values (the child is two years old!).
After RBC IC diminished to 6 on the right, to 7 on the left.
This example obviously demonstrates that the child reflects the parents’ problems (see two previous findings) and proves that the child’s and the parents’ health shall be restored simultaneously.
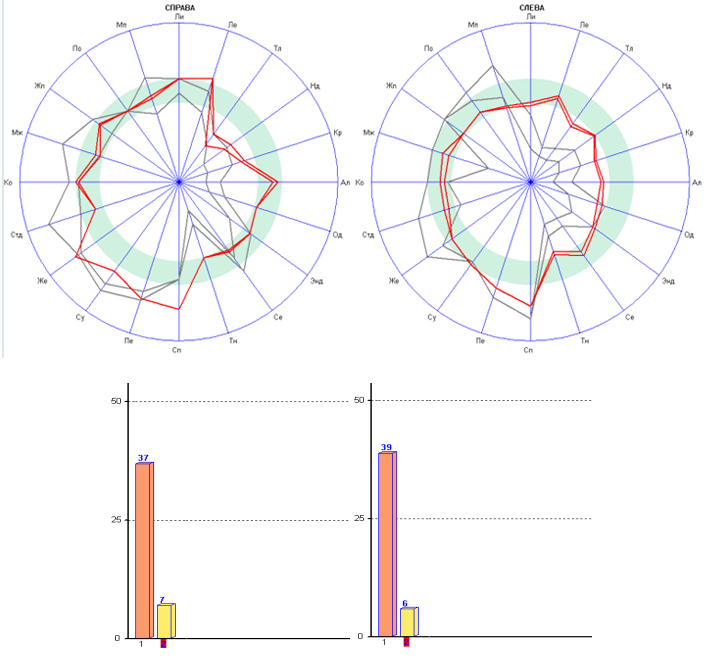
Patient К. 38 years old
Prior to RBC asymmetric circle diagrams due to depression of the most upper body meridians and activation of the most lower body meridians. Energy source is well-preserved but EP is lost within 10 seconds of measurement.
After RBC circle diagrams are more symmetric, as depression of the upper body meridians and activation of the lower body meridians decreased.
Prior to RBC IC of deviation from norm is high: on the right 37, on the left 39.
After RBC IC decreased to 7 on the right, to 6 on the left.
Patient К. 51 years old
Prior to RBC asymmetry of circle diagrams due to moderate depression of the upper body meridians. Energy source is reduced insignificantly but EP is lost within 10 seconds of measurement.
After RBC energy source is restored, diagrams are more symmetric. The liver meridian is acrivated on both sides (load on the filtering organ).
Prior to RBC IC of deviation from norm on the right 21, on the left 22.
After RBC IC decreased to min value: 3 on both sides.
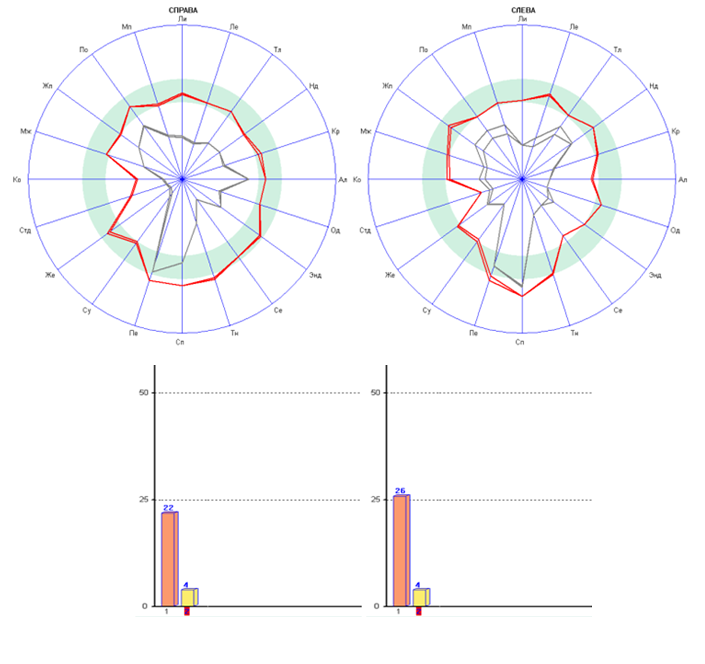
Patient К. 65 years old
Prior to RBC a very low energy source, depression of most meridians. At this background the liver meridian on the right and the spleen meridian on the left are relatively active (load on the filtering organ and the immune system).
After RBC energy source is restored, depression of the skin meridian on the right and depression of the degeneration of the connective tissue meridian on both sides remain.
Prior to RBC IC of deviation from norm values are asymmetric: on the right 22, on the left 26.
After RBC IC decreased to minimum – 4, no asymmetry.
Patient К. 62 years old
Prior to RBC asymmetric circle diagrams, energy source is reduced, loss of EP within 10 seconds of measurement. At the background of depression of most meridians, the liver meridian is active on both sides and the urinary bladder is active on the left.
After RBC energy source increased, but asymmetry of diagrams remained.
Prior to RBC IC of deviation from norm – 33.
After RBC IC decreased to 5.
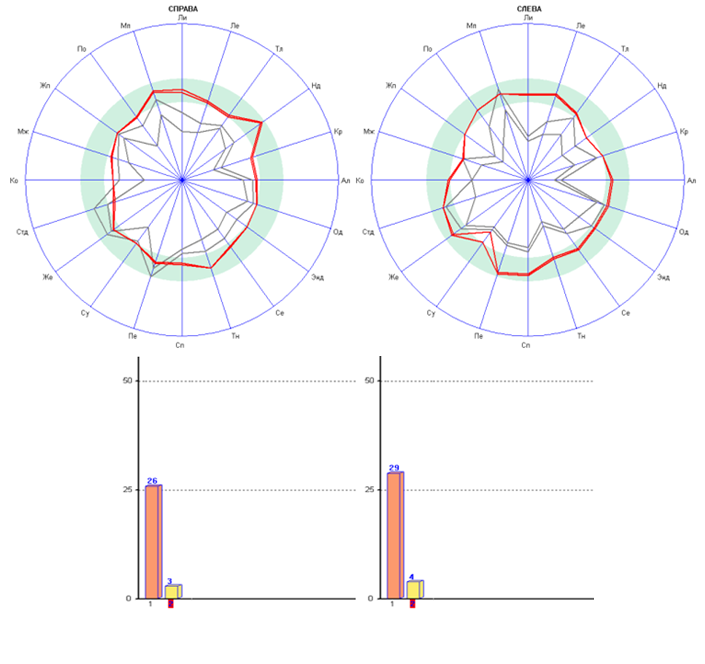
Patient К. 53 years old
Prior to RBC – moderately reduced energy source, EP loss within 10 seconds of measurements with respect to virtually all meridians.
After RBC energy source is restored, there is no loss of potential.
Prior to RBC moderately increased IC of deviation from norm: on the right 26, on the left 29.
After RBC IC decreased to minimum values: on the right 3, on the left 4, asymmetry of values decreased.
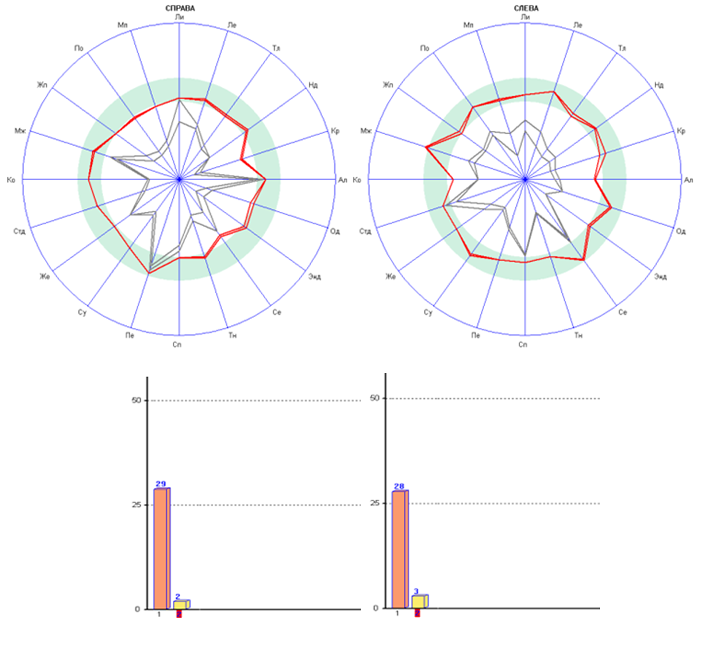
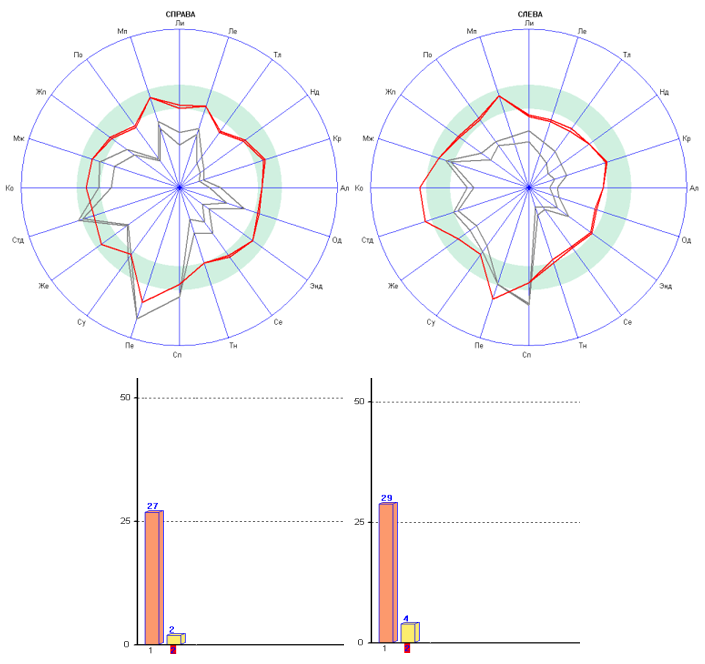
Patient К. 45 years old
Prior to RBC asymmetric circle diagrams, low energy source.
After RBC energy source and diagrams symmetry are restored.
Prior to RBC – moderately increased IC of deviation from norm: on the right 29, on the left 28.
After RBC IC decreased to minimum values: on the right 2, on the left 3.
Patient L. 61 years old
Prior to RBC distinctly asymmetric circle diagrams, most meridians are depressed, EP loss within 10 seconds of measurement, energy source is strongly reduced.
After RBC very good dynamics – energy source and diagrams symmetry are restored.
Prior to RBC IC of deviation from norm was moderately increased, but values were prominently asymmetric: on the right 35, on the left 29, which evidences disparity of the right and left hemispheres.
After RBC IC decreased to minimum values: on the right 4, on the left 3, asymmetry of values diminished.
Patient L. 38 years old
Prior to RBC asymmetric circle diagrams, most meridians are depressed (low energy source). At this background the liver and the pancreas/ spleen meridians are active on the right, which evidences a load on filtering organs. After RBC energy source increased considerably, the diagram remained asymmetric due to activation of the liver and kidney meridian, the left part of the diagram is quite symmetric.
Prior to RBC IC of deviation from norm values were asymmetric: on the right 30, on the left 26.
After RBC IC on the right decreased to 6, on the left – to 4, asymmetry diminished.
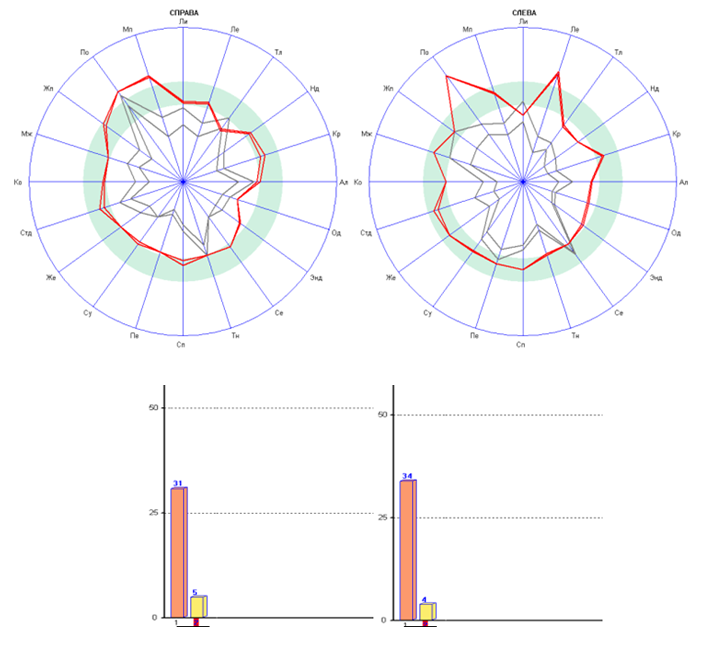
Patient М. 53 years old
Prior to RBC asymmetric circle diagrams, considerable loss of EP within 10 seconds of measurement, energy source is reduced.
After RBC energy source is restored, activation of the kidneys meridian, which is more pronounced on the left, and activation of the lungs meridian on the left.
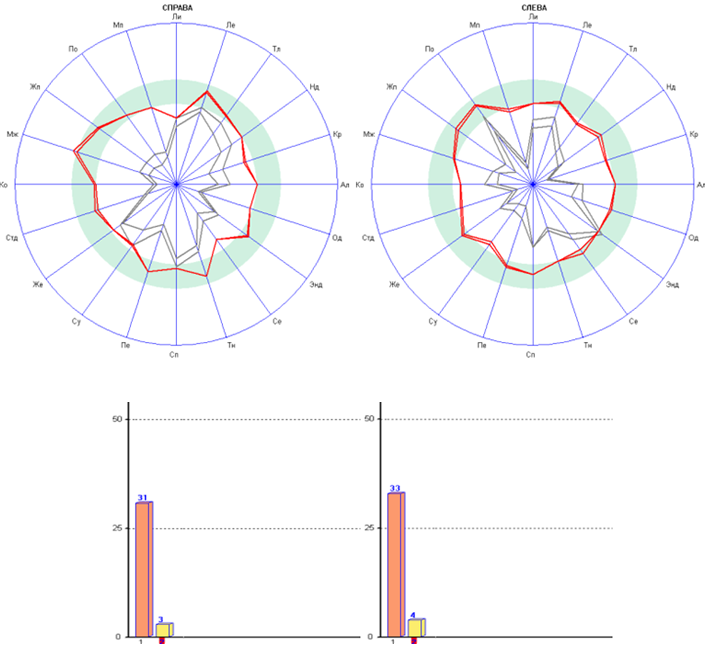
Prior to RBC IC of deviation from norm is increased: on the right 31, on the left 34.
After RBC – positive dynamics: IC on the right 5, on the left 4.
Patient М. 35 years old
Prior to RBC asymmetric circle diagrams, loss of EP within 10 seconds of measurement, especially pronounced on the right, reduced energy source.
After RBC energy source is restored, diagrams are quite symmetric.
Prior to RBC increased IC of deviation from norm: on the right 34, on the left 28, asymmetry of values, evidencing predominance of the right hemisphere.
After RBC IC diminished to minimum values – 3 on both sides, there are no asymmetry.
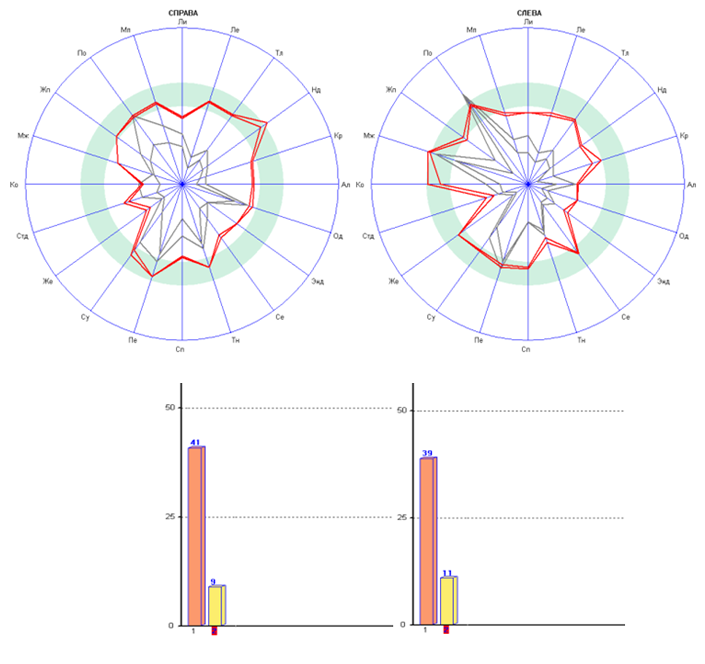
Patient М. 49 years old
Prior to RBC prominent asymmetry of circle diagrams, energy source is low, more pronounced depression of the upper body meridians. Relative activation of the left kidney meridian (load on the organ).
After RBC energy source increased considerably, less evident asymmetry.
Prior to RBC very high IC of deviation from norm: on the right 41, on the left 39.
After RBC IC diminished to 9 on the right, to 11 on the left.
Patient М. 49 years old
Prior to RBC strongly pronounced asymmetry of circle diagrams due to depression of the upper body meridians and relative activation of the kidney meridian on the right and the spleen, liver, stomach and kidney meridians on the left. Low energy source.
After RBC – positive dynamics: energy source and diagrams symmetry are restored.
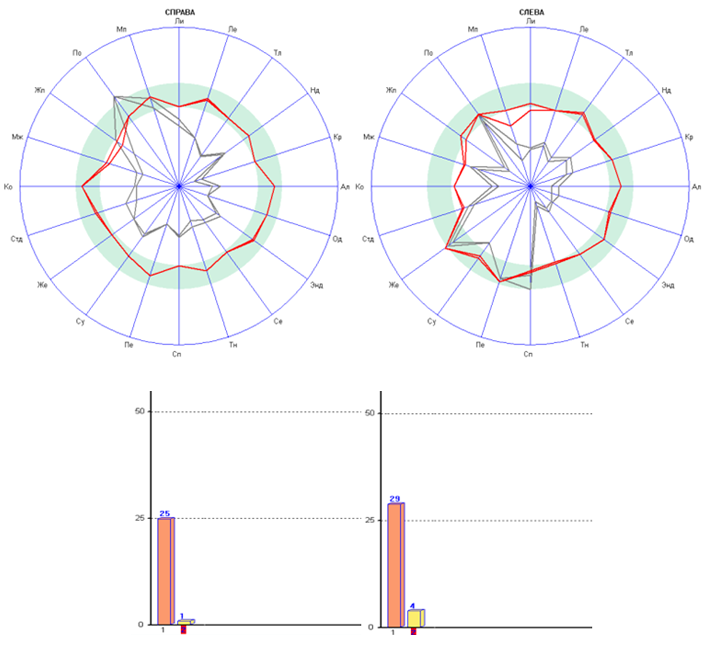
Prior to RBC IC of deviation from norm on the right 25, on the left 29, values are asymmetric.
After RBC IC decreased to minimum values: on the right 1, on the left 4, values remain asymmetric.
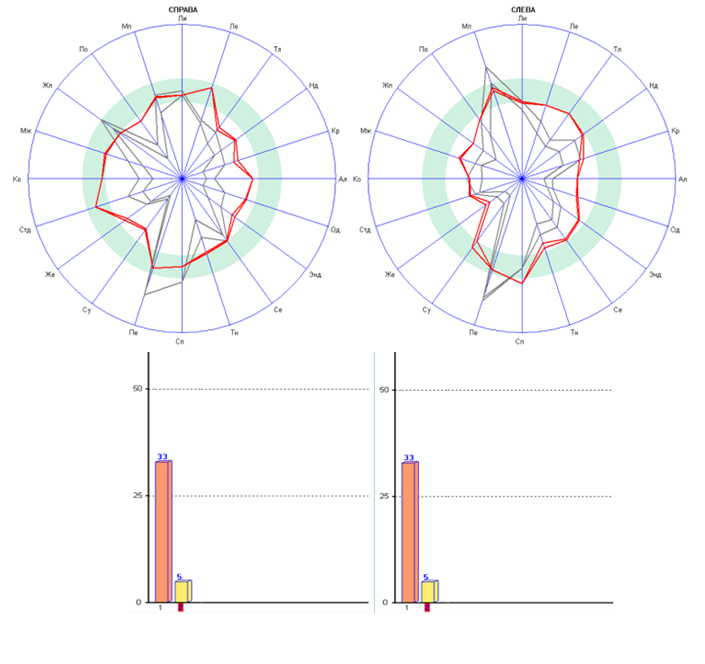
Patient P. 41 years old
Prior to RBC asymmetric circle diagrams, loss of EP within 10 seconds of measurement, reduced energy source.
After RBC energy source is restored, circle diagrams are quite symmetric, the right kidney meridian is activated (load on the filtering organ).
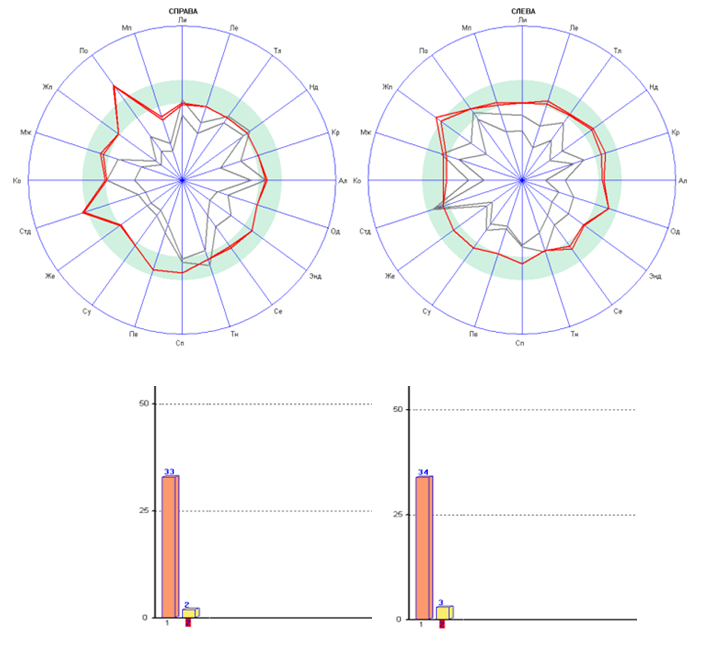
Prior to RBC IC of deviation from norm on the right 33, on the left 34.
After RBC IC decreased to minimum values: on the right 2, on the left 3.
Patient P. 35 years old
Prior to RBC strongly pronounced asymmetry of circle diagrams due to uneven depression of most meridians. Energy source is reduced.
After RBC – positive dynamics – energy source increased, diagrams are considerably less asymmetric.
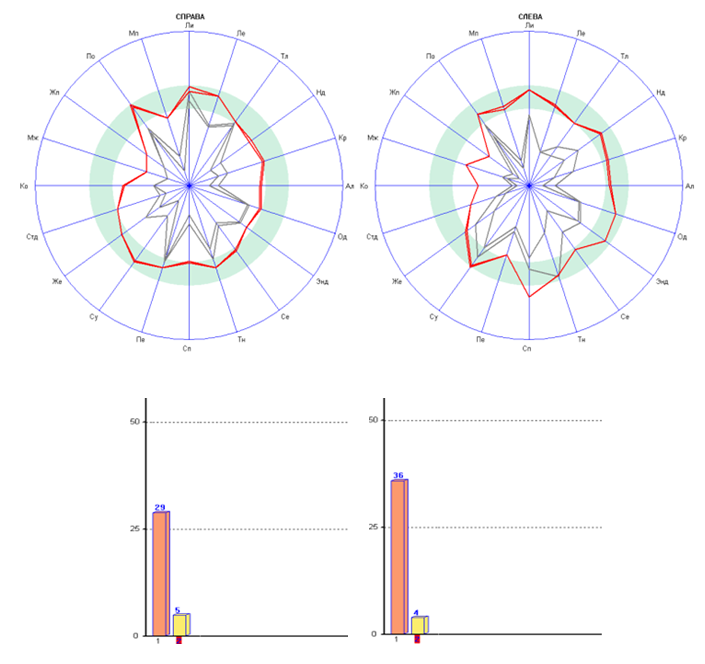
Prior to RBC asymmetric values of IC of deviation from norm: on the right 29, on the left 36.
After RBC IC decreased to 5 on the right, to 4 on the left, asymmetry diminished.
Patient P. 18 years old
Prior to RBC strongly pronounced asymmetry of circle diagrams. Low energy source.
Most meridians are depressed. At this background the right kidney meridian and the spleen and liver meridians on the left are relatively activated.
After RBC – excellent dynamics: energy source and diagrams symmetry are restored.
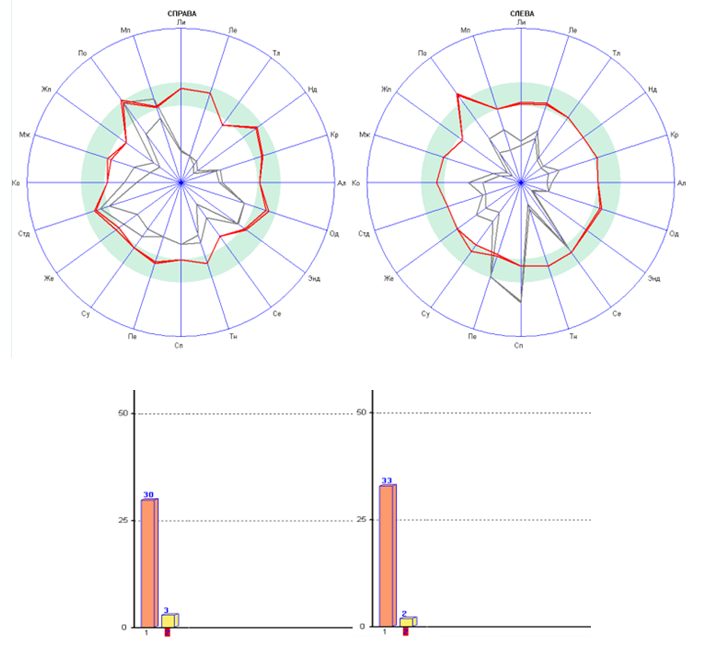
Prior to RBC IC of deviation from norm on the right 30, on the left 33.
After RBC IC values are minimum: on the right 3, on the left 2.
Patient P. 64 years old
Prior to RBC asymmetric circle diagrams, low energy source.
After RBC – excellent dynamics: energy source and diagrams symmetry are restored.
Prior to RBC IC of deviation from norm on the right 31, on the left 33.
After RBC minimum values of IC; on the right 3, on the left 4.
Excellent result of RBC with a senior patient.
Patient R. 17 years old
Prior to RBC a pronounced asymmetry of circle diagrams – on the right almost all meridians are depressed, on the left the low body meridians are more depressed.
Low energy source.
After RBC energy source is restored, diagrams are quite symmetric, the kidney meridian is activated on both sides (load on the filtering organ).
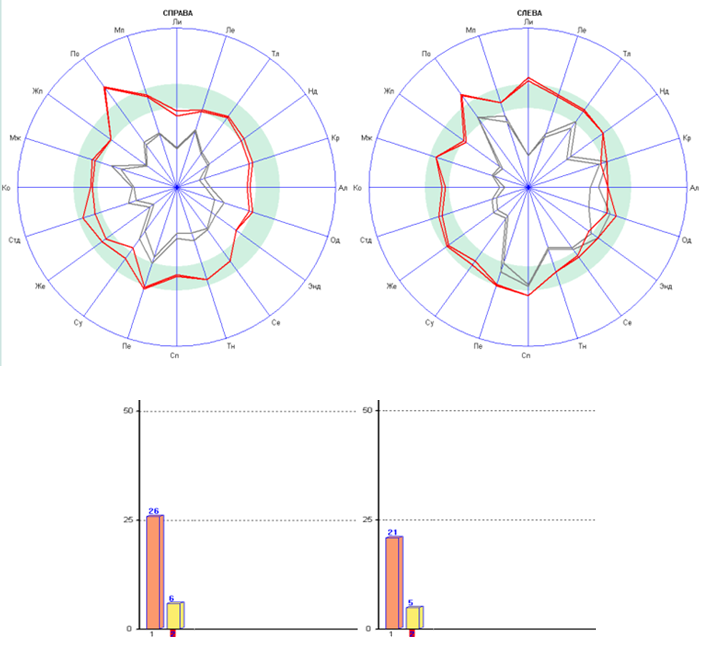
Prior to RBC asymmetric values of IC of deviation from norm: on the right 26, on the left 21 (predominance of the right hemisphere).
After RBC IC decreased to 6 on the right and to 5 on the left – asymmetry decreased considerably.
Patient R. 41 years old
Prior to RBC asymmetric circle diagrams with considerable loss of EP within 10 seconds of measurement. Energy source is reduced.
After RBC energy source is restored, diagrams are quite symmetric. Activation of the kidney and the urinary bladder meridians on the right (load on the filtering organ after RBC).
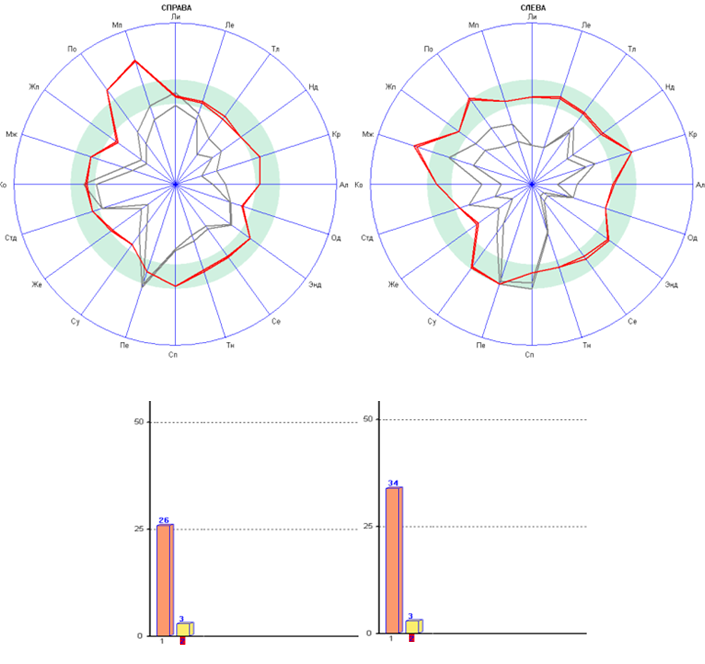
Prior to RBC a pronounced asymmetry of IC of deviation from norm: on the right 26, on the left 34.
After RBC there is no asymmetry, minimum IC values: 3 on both sides.
Patient R. 39 years old
Prior to RBC asymmetric circle diagrams, activation of the degeneration of joints meridian at the background of most other meridians depression. Considerable loss of EP within 10 seconds of measurement. Low energy source.
After RBC energy source is restored, diagrams are more symmetric. The degeneration of joints meridian remains active and the right kidney meridian is activated.
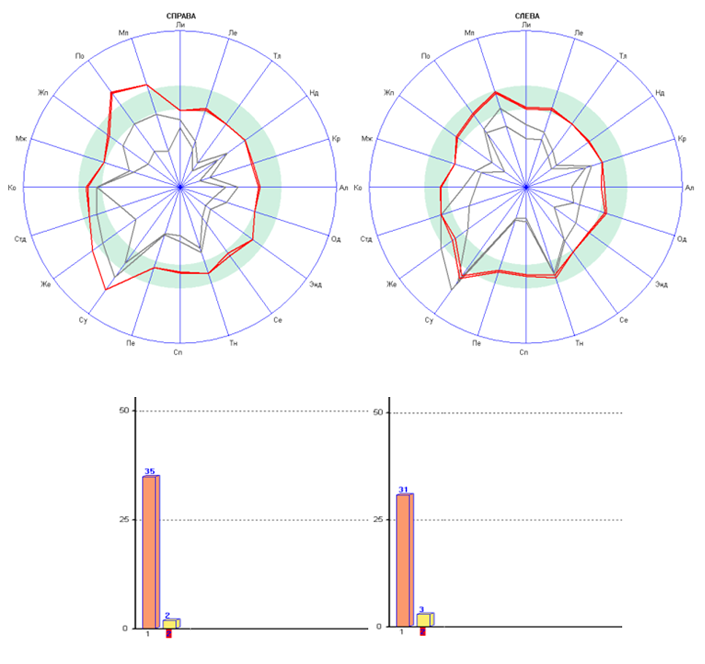
Prior to RBC – considerably high IC of deviation from norm: on the right 35, on the left 31.
After RBC IC diminished to minimum values: on the right 2, on the left 3, asymmetry of values decreased.
Patient S. 50 years old
Prior to RBC asymmetric circle diagrams due to a more pronounced depression of the upper body meridians. At this background the kidneys meridian is activated on both sides. Low energy source.
After RBC energy source is restored, diagrams are more symmetric. The kidneys meridian remains active. The degeneration of connective tissue and adipose degeneration meridians on both sides became active.
Findings
All the examined patients irrespective of pathology had reduced energy source and disparity of hemispheres, evidenced by asymmetry of circle diagrams. After noncontact Resonance Bio-Correction all patients had considerably increased or completely restored energy source and symmetry of circle diagrams. Therefore, noncontact Resonance Bio-Correction is a highly efficient method of energy source restoration and central nervous system harmonization.